9 ways to improve your algo/robot using Trademetria

Nowadays creating a robot is no longer limited to financial wizards. It's quick and easy, but creating a robot that makes money is a completely different story. Just like manual traders who adjust their strategies as the market changes, a trading robot also needs to be adjusted frequently to obtain greater profitability. Some systems like Meta Trader are able to create powerful backtesting reports, while others don't provide valuable information to discover where and how your robot is losing. In this post, we will be showing some of the countless resources that Trademetria offers to improve the performance of your robots.
1. What assets or asset classes are most profitable
Sometimes when a robot trades many different assets like equities, cfds and fx, the result of backtesting does not show profit per asset class. You have to do a backtest for each asset class and that can take a lot of time. Without knowing which class or which symbol/pair is most profitable, you can't successfully figure out what the robot should trade.
At Trademetria, you can separate your pnl by asset class and by asset to find out what the most profitable ones are and trade them instead of the poorly performing ones. Below, we can assume that this robot works well with symbol BX, but not so well with LAZ. Cutting the top losers would increase the robot's performance by about 8%.

2. How it performs when costs are included
Your backtest will hardly show your profit and loss with fees included. As with many robots, they trade often and the costs could eat up your profits if you are not aware of them.
At Trademetria, you can configure fees such as commission, settlement fees and even custom fees that will be included in each trade that your robot takes. We also show net and gross pnl. See the big difference it makes in the robot below:
The blue line is gross sales, while the red line represents net sales. If you rely only on gross profit which most backtesting platforms do, you will be in for a big surprise when you go live.
3. How it performs based on timeframe and trading style
How do you know that your robot is losing money daytrading AAPL and making money on swing trades? What if it makes money in the morning and lose in the afternoon session? This information is important to maximize your earnings and every backtest must offer filters by trading type and timeframe.
4. Track pnl on longs vs shorts.
It is important to know if the robot is making money on both sides (long and short) and adjust it according to the results. See an example below how the 178686 robot loses big when it goes short. If it stopped selling short, it would save almost 2k in losses. Your backtest should take this information into account and not just the robot's pnl.

5. Earnings projection
Past performance does not represent future performance. We already know that, but knowing how your earnings are projected over the next 30 days or 1000 trades can help you get a sense of future performance, if performance continues.
At Trademetria, we take into account several metrics such as win rate and average profit and loss to project your results at different trade and time intervals.
6. Establish a daily loss limit
The daily loss limit is a rule of thumb to limit the risk of any trader, manual or automatic. For a robot, this limit is essential, not only to limit "normal" losses, but also to limit losses in the event of a technical problem.
At Trademetria, you can visually see what the ideal daily loss limit should be thus not leaving the robot to bleed unnecessarily.
Where would you put your daily loss limit here?

At $500, the robot would have easily saved $1200.00 during its run. Yes, sometimes the robot can lose $ 2000 and recover everything, but this is usually not the case. It is better to work with data on our side and to limit losses at a $ level than to expect the robot to swing to profits while it is constantly losing for the day.
Meta Trader, for instance, doesn't show the graph of the daily LP, showing only the yield over time. Therefore, you can't identify the ideal value for establishing a daily stop. At Trademetria, you can see the daily pnl in a bar graph just like in the photo above.
7. Avoid unnecessary backtests
Run a backtest for as many years as possible. Then use Trademetria to filter timeframes that interest you. Very often, you have to keep running backtests for many timeframes unnecessarily.
8. Test successful Meta Trader signals
Trademetria has a really cool option to import MT4/5 signal fills for your own backtests.
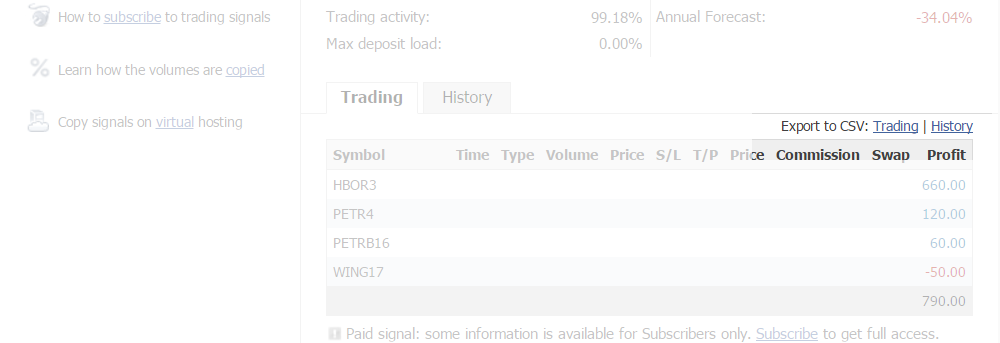
To use this feature, go to the page of the signal you want to analyze, click on the history link and import this file into Trademetria using the Meta Trader Web Export option.
With the trades inserted in Trademetria, you will be able to backtest a winning robot and discover its strengths.
9. Organize your backtests
Robot developers run dozens or hundreds of tests, but it's hard to store the results because they are in html, txt files and this is not very practical to access quickly.
At Trademetria, you can create an account for each backtest, filtering your results by each backtest, instead of generating these backtests again and again as you typically do using Meta Trader.
Conclusion
In addition to the features discussed here, Trademetria also has a large number of metrics that are essential for analyzing robots like profit factor, win rate, average wins, losses, drawdowns and more.
As you can see, there are many ways to analyze the performance of your robots. I hope I have given you some ways to maximize your gains with our tool.
Open a Trademetria account and start testing your robots today!